Other Articles
- SQL Database – Enable Database Encryption
- SQL Server – Enable SQL Defender
- SQL Database – Monitor CPU Utilization
- SQL Database – Monitor Memory Utilization
- SQL Database – Protect From Direct Internet Traffic
- Storage Account – Enable Storage Encryption
- Storage Account – Disable Blob Public Access
- Storage Account – Disable Cross-Tenant Replication
- Storage Account – Disable Public Network Access
- Storage Account – Enable Microsoft Defender
- Storage Account – Enable Secure Transfer
- Storage Account – Enforce Minimum TLS Version
- Storage Account – Enforce Network Access Rule
- Storage Account – Enforce Private Endpoint Access
- User – Enable Azure MFA
- App Service – Disable Remote Debugging
- App Service – Enable Defender
- App Service – Enable Entra ID Registration
- App Service – Enable HTTP2
- App Service – Enforce Latest TLS Version
- App Service – Enforce Secure FTPS State
- App Service – Monitor Server Errors
- App Service – Redirect HTTP to HTTPS
- Cosmos DB – Enable Backup
- Cosmos DB – Enable Microsoft Defender
- Cosmos DB – Monitor Latency
- Cosmos DB – Ensure Private Connectivity
- Cosmos DB for PostgreSQL – Monitor CPU Utilization
- Cosmos DB for PostgreSQL – Monitor IO Utilization
- Cosmos DB for PostgreSQL – Monitor Memory Utilization
- Cosmos DB for PostgreSQL – Protect From Direct Internet Traffic
- Cosmos DB – Protect From Direct Internet Traffic
- Cosmos DB – Restrict Firewall Network Access
- Virtual Machine – Enable Defender
- Virtual Machine – Protect From Direct Internet Traffic
- Key Vault – Enable Defender
- Key Vault – Ensure Vault Recoverable
- Key Vault – Require Private Endpoint Access
- MySQL Flexible Server – Enable Audit Log Events Connection
- MySQL Flexible Server – Enable Audit Logs
- MySQL Flexible Server – Enforce Minimum TLS Version
- PostgreSQL Flexible Server – Configure Log File Retention
- PostgreSQL Flexible Server – Enable Connection Logging
- PostgreSQL Flexible Server – Enable Connection Throttling
- PostgreSQL Flexible Server – Enable Disconnection Logging
- PostgreSQL Flexible Server – Enable Log Checkpoints
- Network Security Group – Ensure Flow Logs Captured
- General – Enable Auto Provisioning Log Analytics
- General – Enable Security Notifications
- General – Set Additional Email Address
SQL Database – Monitor IO Utilization
This check ensures that Input/Output (IO) utilization for Azure SQL Databases is actively monitored. Monitoring IO usage helps identify disk bottlenecks, slow query performance, and resource saturation that can impact database availability and responsiveness.
Check Details
- Resource: SQL Server / SQL Database
- Check: Monitor SQL Databases IO Utilization
- Risk: Without IO utilization monitoring, storage bottlenecks and excessive disk usage may go undetected, resulting in slow query execution, application latency, and potential service disruption.
Remediation via Azure Portal
-
Log in to the Azure Portal.
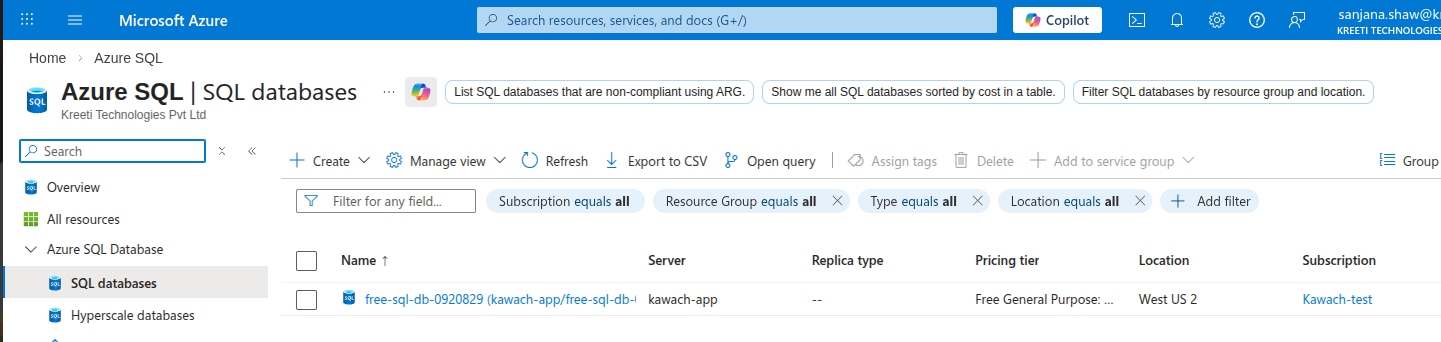
- Navigate to Azure SQL Databases.
-
Select the target SQL Database.
-
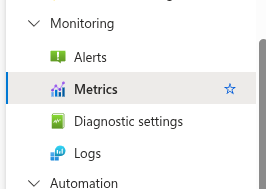
From the left-hand menu, go to Monitoring →
Metrics.
-
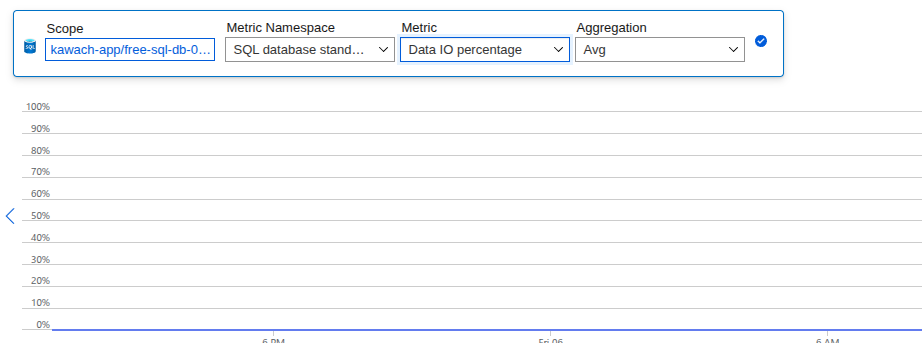
In the metrics configuration:
- Select Data IO percentage and Log IO percentage
- Choose an appropriate time range
- Analyze IO utilization trends
-
Configure Alerts on IO utilization metrics to receive
notifications when thresholds are exceeded.
Monitoring via Azure Monitor (Recommended)
Azure SQL Databases automatically publish IO utilization metrics to Azure Monitor. Configuring alerts ensures proactive detection of storage performance issues.
-
Open Azure Cloud Shell.

-
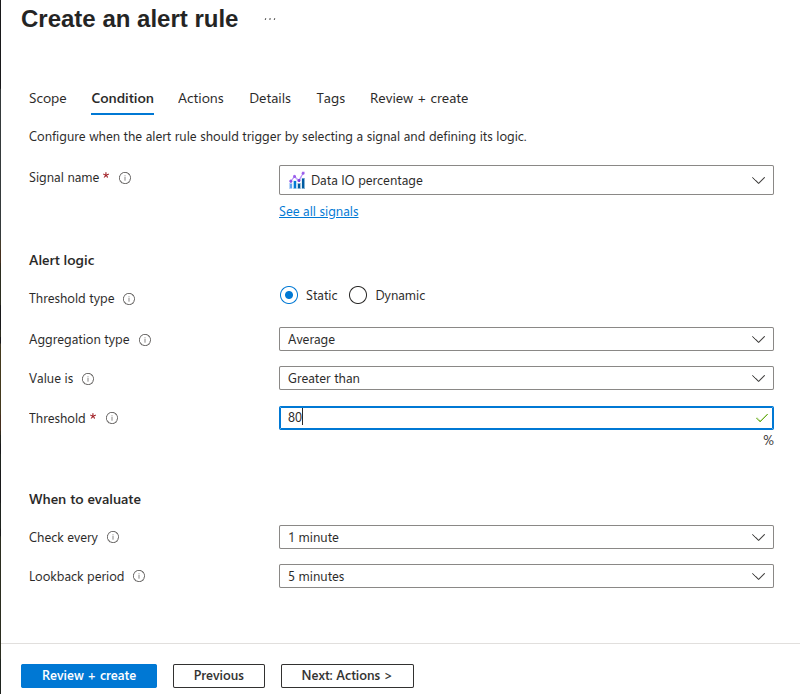
Create an IO utilization alert rule:
az monitor metrics alert create \
  --name HighIOUtilizationAlert \
  --resource-group <resource-group-name> \
  --scopes <sql-database-resource-id> \
  --condition "avg data_io_percent > 80" \
  --window-size 5m \
  --evaluation-frequency 1m \
  --severity 2
This alert triggers when average IO utilization exceeds acceptable limits, enabling teams to investigate and optimize storage performance proactively.